

- 1 Welcome to PRTG
- 2 Quick Start Guide
- 3 Using PRTG Hosted Monitor
- 4 Installing the Software
- 5 Understanding Basic Concepts
- 6 Basic Procedures
- 6.1 Login
- 6.2 Customer Service
- 6.3 Sensor States
- 6.4 Historic Data Reports
- 6.5 Similar Sensors
- 6.6 Recommended Sensors
- 6.7 Object Settings
- 6.8 Alarms
- 6.9 System Information
- 6.10 Logs
- 6.11 Tickets
- 6.12 Working with Table Lists
- 6.13 Object Selector
- 6.14 Priority and Favorites
- 6.15 Pause
- 6.16 Context Menus
- 6.17 Hover Popup
- 7 Device and Sensor Setup
- 7.1 Auto-Discovery
- 7.2 Create Objects Manually
- 7.3 Manage Device Tree
- 7.4 Root Group Settings
- 7.5 Probe Settings
- 7.6 Group Settings
- 7.7 Device Settings
- 7.8 Sensor Settings
- 7.8.1 Active Directory Replication Errors Sensor
- 7.8.2 ADO SQL v2 Sensor
- 7.8.3 Application Server Health (Autonomous) Sensor
- 7.8.4 AWS Alarm v2 Sensor
- 7.8.5 AWS Cost Sensor
- 7.8.6 AWS EBS v2 Sensor
- 7.8.7 AWS EC2 v2 Sensor
- 7.8.8 AWS ELB v2 Sensor
- 7.8.9 AWS RDS v2 Sensor
- 7.8.10 Beckhoff IPC System Health Sensor
- 7.8.11 Business Process Sensor
- 7.8.12 Cisco IP SLA Sensor
- 7.8.13 Cisco Meraki License Sensor
- 7.8.14 Cisco Meraki Network Health Sensor
- 7.8.15 Cisco WLC Access Point Overview Sensor
- 7.8.16 Citrix XenServer Host Sensor
- 7.8.17 Citrix XenServer Virtual Machine Sensor
- 7.8.18 Cloud HTTP v2 Sensor
- 7.8.19 Cloud Ping v2 Sensor
- 7.8.20 Cluster Health Sensor
- 7.8.21 Core Health Sensor
- 7.8.22 Core Health (Autonomous) Sensor
- 7.8.23 Dell EMC Unity Enclosure Health v2 Sensor
- 7.8.24 Dell EMC Unity File System v2 Sensor
- 7.8.25 Dell EMC Unity Storage Capacity v2 Sensor
- 7.8.26 Dell EMC Unity Storage LUN v2 Sensor
- 7.8.27 Dell EMC Unity Storage Pool v2 Sensor
- 7.8.28 Dell EMC Unity VMware Datastore v2 Sensor
- 7.8.29 Dell PowerVault MDi Logical Disk Sensor
- 7.8.30 Dell PowerVault MDi Physical Disk Sensor
- 7.8.31 DHCP Sensor
- 7.8.32 DICOM Bandwidth Sensor
- 7.8.33 DICOM C-ECHO Sensor
- 7.8.34 DICOM Query/Retrieve Sensor
- 7.8.35 DNS v2 Sensor
- 7.8.36 Docker Container Status Sensor
- 7.8.37 Event Log (Windows API) Sensor
- 7.8.38 Exchange Backup (PowerShell) Sensor
- 7.8.39 Exchange Database (PowerShell) Sensor
- 7.8.40 Exchange Database DAG (PowerShell) Sensor
- 7.8.41 Exchange Mail Queue (PowerShell) Sensor
- 7.8.42 Exchange Mailbox (PowerShell) Sensor
- 7.8.43 Exchange Public Folder (PowerShell) Sensor
- 7.8.44 EXE/Script Sensor
- 7.8.45 EXE/Script Advanced Sensor
- 7.8.46 File Sensor
- 7.8.47 File Content Sensor
- 7.8.48 Folder Sensor
- 7.8.49 FortiGate System Statistics Sensor
- 7.8.50 FortiGate VPN Overview Sensor
- 7.8.51 FTP Sensor
- 7.8.52 FTP Server File Count Sensor
- 7.8.53 FTP Server File Count v2 Sensor
- 7.8.54 HL7 Sensor
- 7.8.55 HPE 3PAR Common Provisioning Group Sensor
- 7.8.56 HPE 3PAR Drive Enclosure Sensor
- 7.8.57 HPE 3PAR Virtual Volume Sensor
- 7.8.58 HTTP Sensor
- 7.8.59 HTTP v2 Sensor
- 7.8.60 HTTP Advanced Sensor
- 7.8.61 HTTP Apache ModStatus PerfStats Sensor
- 7.8.62 HTTP Apache ModStatus Totals Sensor
- 7.8.63 HTTP Content Sensor
- 7.8.64 HTTP Data Advanced Sensor
- 7.8.65 HTTP IoT Push Data Advanced Sensor
- 7.8.66 HTTP Push Count Sensor
- 7.8.67 HTTP Push Data Sensor
- 7.8.68 HTTP Push Data Advanced Sensor
- 7.8.69 HTTP Transaction Sensor
- 7.8.70 HTTP Webpage Sensor
- 7.8.71 HTTP XML/REST Value Sensor
- 7.8.72 Hyper-V Cluster Shared Volume Disk Free Sensor
- 7.8.73 Hyper-V Host Server Sensor
- 7.8.74 Hyper-V Virtual Machine Sensor
- 7.8.75 Hyper-V Virtual Network Adapter Sensor
- 7.8.76 Hyper-V Virtual Storage Device Sensor
- 7.8.77 IMAP Sensor
- 7.8.78 IP on DNS Blacklist Sensor
- 7.8.79 IP Reputation Score Sensor
- 7.8.80 IPFIX Sensor
- 7.8.81 IPFIX (Custom) Sensor
- 7.8.82 IPMI System Health Sensor
- 7.8.83 jFlow v5 Sensor
- 7.8.84 jFlow v5 (Custom) Sensor
- 7.8.85 LDAP Sensor
- 7.8.86 Local Folder Sensor
- 7.8.87 Microsoft 365 Mailbox Sensor
- 7.8.88 Microsoft 365 Service Status Sensor
- 7.8.89 Microsoft 365 Service Status Advanced Sensor
- 7.8.90 Microsoft Azure SQL Database Sensor
- 7.8.91 Microsoft Azure Storage Account Sensor
- 7.8.92 Microsoft Azure Subscription Cost Sensor
- 7.8.93 Microsoft Azure Virtual Machine Sensor
- 7.8.94 Microsoft SQL v2 Sensor
- 7.8.95 Modbus RTU Custom Sensor
- 7.8.96 Modbus TCP Custom Sensor
- 7.8.97 MQTT Round Trip Sensor
- 7.8.98 MQTT Statistics Sensor
- 7.8.99 MQTT Subscribe Custom Sensor
- 7.8.100 Multi-Platform Probe Connection Health (Autonomous) Sensor
- 7.8.101 Multi-Platform Probe Health Sensor
- 7.8.102 MySQL v2 Sensor
- 7.8.103 NATS Server Overview Sensor
- 7.8.104 NetApp Aggregate Sensor
- 7.8.105 NetApp Aggregate v2 Sensor
- 7.8.106 NetApp I/O Sensor
- 7.8.107 NetApp I/O v2 Sensor
- 7.8.108 NetApp LIF Sensor
- 7.8.109 NetApp LIF v2 Sensor
- 7.8.110 NetApp LUN Sensor
- 7.8.111 NetApp LUN v2 Sensor
- 7.8.112 NetApp NIC Sensor
- 7.8.113 NetApp NIC v2 Sensor
- 7.8.114 NetApp Physical Disk Sensor
- 7.8.115 NetApp Physical Disk v2 Sensor
- 7.8.116 NetApp SnapMirror Sensor
- 7.8.117 NetApp SnapMirror v2 Sensor
- 7.8.118 NetApp System Health Sensor
- 7.8.119 NetApp System Health v2 Sensor
- 7.8.120 NetApp Volume Sensor
- 7.8.121 NetApp Volume v2 Sensor
- 7.8.122 NetFlow v5 Sensor
- 7.8.123 NetFlow v5 (Custom) Sensor
- 7.8.124 NetFlow v9 Sensor
- 7.8.125 NetFlow v9 (Custom) Sensor
- 7.8.126 Network Share Sensor
- 7.8.127 OPC UA Certificate Sensor
- 7.8.128 OPC UA Custom Sensor
- 7.8.129 OPC UA Server Status Sensor
- 7.8.130 Oracle SQL v2 Sensor
- 7.8.131 Oracle Tablespace Sensor
- 7.8.132 Packet Sniffer Sensor
- 7.8.133 Packet Sniffer (Custom) Sensor
- 7.8.134 PerfCounter Custom Sensor
- 7.8.135 PerfCounter IIS Application Pool Sensor
- 7.8.136 Ping Sensor
- 7.8.137 Ping v2 Sensor
- 7.8.138 Ping Jitter Sensor
- 7.8.139 Ping Jitter v2 Sensor
- 7.8.140 POP3 Sensor
- 7.8.141 Port Sensor
- 7.8.142 Port v2 Sensor
- 7.8.143 Port Range Sensor
- 7.8.144 PostgreSQL Sensor
- 7.8.145 Probe Health Sensor
- 7.8.146 Proxmox VE Cluster Health Sensor
- 7.8.147 Proxmox VE Container Status Sensor
- 7.8.148 Proxmox VE Virtual Machine Status Sensor
- 7.8.149 Proxmox VE Node Performance Sensor
- 7.8.150 PRTG Data Hub Process Sensor
- 7.8.151 PRTG Data Hub Rule Sensor
- 7.8.152 PRTG Data Hub Traffic Sensor
- 7.8.153 QoS (Quality of Service) One Way Sensor
- 7.8.154 QoS (Quality of Service) Round Trip Sensor
- 7.8.155 RADIUS v2 Sensor
- 7.8.156 RDP (Remote Desktop) Sensor
- 7.8.157 RDP Client-Side Check Sensor
- 7.8.158 Redfish Fan Status Sensor
- 7.8.159 Redfish Power Supply Sensor
- 7.8.160 Redfish System Health Sensor
- 7.8.161 Redfish Temperature Sensor
- 7.8.162 Redfish Virtual Disk Sensor
- 7.8.163 REST Custom Sensor
- 7.8.164 REST Custom v2 Sensor
- 7.8.165 REST JSON Data Sensor
- 7.8.166 Script v2 Sensor
- 7.8.167 Sensor Factory Sensor
- 7.8.168 sFlow Sensor
- 7.8.169 sFlow (Custom) Sensor
- 7.8.170 Share Disk Free Sensor
- 7.8.171 SIMATIC S7-1200/1500 Alarm Status Sensor (BETA)
- 7.8.172 SIMATIC S7-1200/1500 CPU Status Sensor
- 7.8.173 SIMATIC S7-1200/1500 Hardware Status Sensor (BETA)
- 7.8.174 SIMATIC S7-300/400 CPU Restart Overview Sensor (BETA)
- 7.8.175 SIMATIC S7-300/400 CPU Status Sensor (BETA)
- 7.8.176 SIMATIC S7-300/400 LED Status (BETA)
- 7.8.177 SIP Options Ping Sensor
- 7.8.178 SMTP Sensor
- 7.8.179 SMTP&IMAP Round Trip Sensor
- 7.8.180 SMTP&POP3 Round Trip Sensor
- 7.8.181 SNMP APC Hardware Sensor
- 7.8.182 SNMP Buffalo TS System Health Sensor
- 7.8.183 SNMP Cisco ADSL Sensor
- 7.8.184 SNMP Cisco ASA VPN Connections Sensor
- 7.8.185 SNMP Cisco ASA VPN Traffic Sensor
- 7.8.186 SNMP Cisco ASA VPN Users Sensor
- 7.8.187 SNMP Cisco CBQoS Sensor
- 7.8.188 SNMP Cisco System Health Sensor
- 7.8.189 SNMP Cisco UCS Blade Sensor
- 7.8.190 SNMP Cisco UCS Chassis Sensor
- 7.8.191 SNMP Cisco UCS Physical Disk Sensor
- 7.8.192 SNMP Cisco UCS System Health Sensor
- 7.8.193 SNMP CPU Load Sensor
- 7.8.194 SNMP CPU Usage Sensor
- 7.8.195 SNMP Custom Sensor
- 7.8.196 SNMP Custom Advanced Sensor
- 7.8.197 SNMP Custom String Sensor
- 7.8.198 SNMP Custom String v2 Sensor
- 7.8.199 SNMP Custom String Lookup Sensor
- 7.8.200 SNMP Custom Table Sensor
- 7.8.201 SNMP Custom v2 Sensor
- 7.8.202 SNMP Dell EqualLogic Logical Disk Sensor
- 7.8.203 SNMP Dell EqualLogic Member Health Sensor
- 7.8.204 SNMP Dell EqualLogic Physical Disk Sensor
- 7.8.205 SNMP Dell Hardware Sensor
- 7.8.206 SNMP Dell PowerEdge Physical Disk Sensor
- 7.8.207 SNMP Dell PowerEdge System Health Sensor
- 7.8.208 SNMP Disk Free Sensor
- 7.8.209 SNMP Disk Free v2 Sensor
- 7.8.210 SNMP Fujitsu System Health v2 Sensor
- 7.8.211 SNMP Hardware Status Sensor
- 7.8.212 SNMP HP LaserJet Hardware Sensor
- 7.8.213 SNMP HPE BladeSystem Blade Sensor
- 7.8.214 SNMP HPE BladeSystem Enclosure Health Sensor
- 7.8.215 SNMP HPE ProLiant Logical Disk Sensor
- 7.8.216 SNMP HPE ProLiant Memory Controller Sensor
- 7.8.217 SNMP HPE ProLiant Network Interface Sensor
- 7.8.218 SNMP HPE ProLiant Physical Disk Sensor
- 7.8.219 SNMP HPE ProLiant System Health Sensor
- 7.8.220 SNMP IBM System X Logical Disk Sensor
- 7.8.221 SNMP IBM System X Physical Disk Sensor
- 7.8.222 SNMP IBM System X Physical Memory Sensor
- 7.8.223 SNMP IBM System X System Health Sensor
- 7.8.224 SNMP interSeptor Pro Environment Sensor
- 7.8.225 SNMP Juniper NS System Health Sensor
- 7.8.226 SNMP LenovoEMC Physical Disk Sensor
- 7.8.227 SNMP LenovoEMC System Health Sensor
- 7.8.228 SNMP Library Sensor
- 7.8.229 SNMP Linux Block Device I/O Sensor
- 7.8.230 SNMP Linux Disk Free Sensor
- 7.8.231 SNMP Linux Disk Free v2 Sensor
- 7.8.232 SNMP Linux Load Average Sensor
- 7.8.233 SNMP Linux Load Average v2 Sensor
- 7.8.234 SNMP Linux Meminfo Sensor
- 7.8.235 SNMP Linux Meminfo v2 Sensor
- 7.8.236 SNMP Linux Physical Disk Sensor
- 7.8.237 SNMP Memory Sensor
- 7.8.238 SNMP Memory v2 Sensor
- 7.8.239 SNMP NetApp Disk Free Sensor
- 7.8.240 SNMP NetApp Enclosure Sensor
- 7.8.241 SNMP NetApp I/O Sensor
- 7.8.242 SNMP NetApp License Sensor
- 7.8.243 SNMP NetApp Logical Unit Sensor
- 7.8.244 SNMP NetApp Network Interface Sensor
- 7.8.245 SNMP NetApp System Health Sensor
- 7.8.246 SNMP Nutanix Cluster Health Sensor
- 7.8.247 SNMP Nutanix Hypervisor Sensor
- 7.8.248 SNMP Poseidon Environment Sensor
- 7.8.249 SNMP Printer Sensor
- 7.8.250 SNMP Printer v2 Sensor
- 7.8.251 SNMP QNAP Logical Disk Sensor
- 7.8.252 SNMP QNAP Physical Disk Sensor
- 7.8.253 SNMP QNAP System Health Sensor
- 7.8.254 SNMP Rittal CMC III Hardware Status Sensor
- 7.8.255 SNMP RMON Sensor
- 7.8.256 SNMP RMON v2 Sensor
- 7.8.257 SNMP SonicWall System Health Sensor
- 7.8.258 SNMP SonicWall VPN Traffic Sensor
- 7.8.259 SNMP Synology Logical Disk Sensor
- 7.8.260 SNMP Synology Physical Disk Sensor
- 7.8.261 SNMP Synology System Health Sensor
- 7.8.262 SNMP System Uptime Sensor
- 7.8.263 SNMP Traffic Sensor
- 7.8.264 SNMP Traffic v2 Sensor
- 7.8.265 SNMP Trap Receiver Sensor
- 7.8.266 SNMP UPS Status Sensor
- 7.8.267 SNMP Uptime v2 Sensor
- 7.8.268 SNMP Windows Service v2 Sensor
- 7.8.269 SNMP Windows Service Sensor
- 7.8.270 SNTP Sensor
- 7.8.271 SNTP v2 Sensor
- 7.8.272 Soffico Orchestra Channel Health Sensor
- 7.8.273 Soffico Orchestra Scenario Sensor
- 7.8.274 SSH Disk Free v2 Sensor
- 7.8.275 SSH INodes Free v2 Sensor
- 7.8.276 SSH Load Average v2 Sensor
- 7.8.277 SSH Meminfo v2 Sensor
- 7.8.278 SSH Remote Ping v2 Sensor
- 7.8.279 SSH SAN Enclosure Sensor
- 7.8.280 SSH SAN Logical Disk Sensor
- 7.8.281 SSH SAN Physical Disk Sensor
- 7.8.282 SSH SAN System Health Sensor
- 7.8.283 SSH Script Sensor
- 7.8.284 SSH Script v2 Sensor
- 7.8.285 SSH Script Advanced Sensor
- 7.8.286 SSL Certificate Sensor
- 7.8.287 SSL Security Check Sensor
- 7.8.288 SSL/TLS Certificate Sensor
- 7.8.289 SSL/TLS Security Check Sensor
- 7.8.290 Syslog Receiver Sensor
- 7.8.291 System Health Sensor
- 7.8.292 System Health v2 Sensor
- 7.8.293 TFTP Sensor
- 7.8.294 Traceroute Hop Count Sensor
- 7.8.295 Traceroute Hop Count v2 Sensor
- 7.8.296 Veeam Backup Job Status Sensor
- 7.8.297 Veeam Backup Job Status Advanced Sensor
- 7.8.298 VMware Datastore (REST) Sensor
- 7.8.299 VMware Datastore (SOAP) Sensor
- 7.8.300 VMware Host Hardware (WBEM) Sensor
- 7.8.301 VMware Host Hardware Status (SOAP) Sensor
- 7.8.302 VMware Host Performance (SOAP) Sensor
- 7.8.303 VMware Virtual Machine (SOAP) Sensor
- 7.8.304 Windows CPU Load Sensor
- 7.8.305 Windows IIS Application Sensor
- 7.8.306 Windows MSMQ Queue Length Sensor
- 7.8.307 Windows Network Card Sensor
- 7.8.308 Windows Pagefile Sensor
- 7.8.309 Windows Physical Disk I/O Sensor
- 7.8.310 Windows Print Queue Sensor
- 7.8.311 Windows Process Sensor
- 7.8.312 Windows SMTP Service Received Sensor
- 7.8.313 Windows SMTP Service Sent Sensor
- 7.8.314 Windows System Uptime Sensor
- 7.8.315 Windows Updates Status (PowerShell) Sensor
- 7.8.316 WMI Battery Sensor
- 7.8.317 WMI CPU Load v2 Sensor
- 7.8.318 WMI Custom Sensor
- 7.8.319 WMI Custom String Sensor
- 7.8.320 WMI Disk Health Sensor
- 7.8.321 WMI Event Log Sensor
- 7.8.322 WMI Exchange Server Sensor
- 7.8.323 WMI Exchange Transport Queue Sensor
- 7.8.324 WMI File Sensor
- 7.8.325 WMI Free Disk Space (Multi Disk) Sensor
- 7.8.326 WMI HDD Health Sensor
- 7.8.327 WMI Logical Disk I/O Sensor
- 7.8.328 WMI Memory Sensor
- 7.8.329 WMI Memory v2 Sensor
- 7.8.330 WMI Microsoft SQL Server Sensor
- 7.8.331 WMI Microsoft SQL Server 2005 Sensor (Deprecated)
- 7.8.332 WMI Microsoft SQL Server 2008 Sensor
- 7.8.333 WMI Microsoft SQL Server 2012 Sensor
- 7.8.334 WMI Microsoft SQL Server 2014 Sensor
- 7.8.335 WMI Microsoft SQL Server 2016 Sensor
- 7.8.336 WMI Microsoft SQL Server 2017 Sensor
- 7.8.337 WMI Microsoft SQL Server 2019 Sensor
- 7.8.338 WMI Microsoft SQL Server 2022 Sensor
- 7.8.339 WMI Network Card v2 Sensor
- 7.8.340 WMI Pagefile v2 Sensor
- 7.8.341 WMI Print Queue v2 Sensor
- 7.8.342 WMI Remote Ping Sensor
- 7.8.343 WMI Security Center Sensor
- 7.8.344 WMI Service Sensor
- 7.8.345 WMI Service v2 Sensor (BETA)
- 7.8.346 WMI Share Sensor
- 7.8.347 WMI SharePoint Process Sensor
- 7.8.348 WMI Storage Pool Sensor
- 7.8.349 WMI System Uptime v2 Sensor
- 7.8.350 WMI Terminal Services (Windows 2008+) Sensor
- 7.8.351 WMI Terminal Services (Windows XP/Vista/2003) Sensor
- 7.8.352 WMI UTC Time Sensor
- 7.8.353 WMI Vital System Data v2 Sensor
- 7.8.354 WMI Volume Sensor
- 7.8.355 WMI Volume v2 Sensor
- 7.8.356 WMI Windows Security Sensor
- 7.8.357 WSUS Statistics Sensor
- 7.8.358 Zoom Service Status Sensor
- 7.9 Additional Sensor Types (Custom Sensors)
- 7.10 Channel Settings
- 7.11 Notification Triggers Settings
- 8 Advanced Procedures
- 8.1 Toplists
- 8.2 Move Objects
- 8.3 Clone Object
- 8.4 Multi-Edit
- 8.5 Create Device Template
- 8.6 Show Dependencies
- 8.7 Geo Maps
- 8.8 Notifications
- 8.9 Libraries
- 8.10 Reports
- 8.11 Maps
- 8.12 Setup
- 9 Desktop Notifications
- 10 Sensor Technologies
- 10.1 Monitoring via SNMP
- 10.2 Monitoring via WMI
- 10.3 Monitoring via SSH
- 10.4 Monitoring Bandwidth via Packet Sniffing
- 10.5 Monitoring Bandwidth via Flows
- 10.6 Bandwidth Monitoring Comparison
- 10.7 Monitoring Quality of Service
- 10.8 Monitoring Backups
- 10.9 Monitoring Virtual Environments
- 10.10 Monitoring Databases
- 10.11 Monitoring via HTTP
- 11 PRTG Administration Tool
- 12 Advanced Topics
- 12.1 Active Directory Integration
- 12.2 Application Programming Interface (API) Definition
- 12.3 Filter Rules for Flow, IPFIX, and Packet Sniffer Sensors
- 12.4 Channel Definitions for Flow, IPFIX, and Packet Sniffer Sensors
- 12.5 Define IP Address Ranges
- 12.6 Define Lookups
- 12.7 Regular Expressions
- 12.8 Calculating Percentiles
- 12.9 Add Remote Probe
- 12.10 Failover Cluster Configuration
- 12.11 Data Storage
- 13 Appendix
- 13.1 Abbreviations
- 13.2 Available Sensor Types
- 13.3 Default Ports
- 13.4 Differences between PRTG Network Monitor and PRTG Hosted Monitor
- 13.5 Escape Special Characters and Whitespaces in Parameters
- 13.6 Glossary
- 13.7 Icons
- 13.8 Legal Notices
- 13.9 Placeholders for Notifications
- 13.10 Standard Lookup Files
- 13.11 Supported AWS Regions and Their Codes
User Manual - Contents
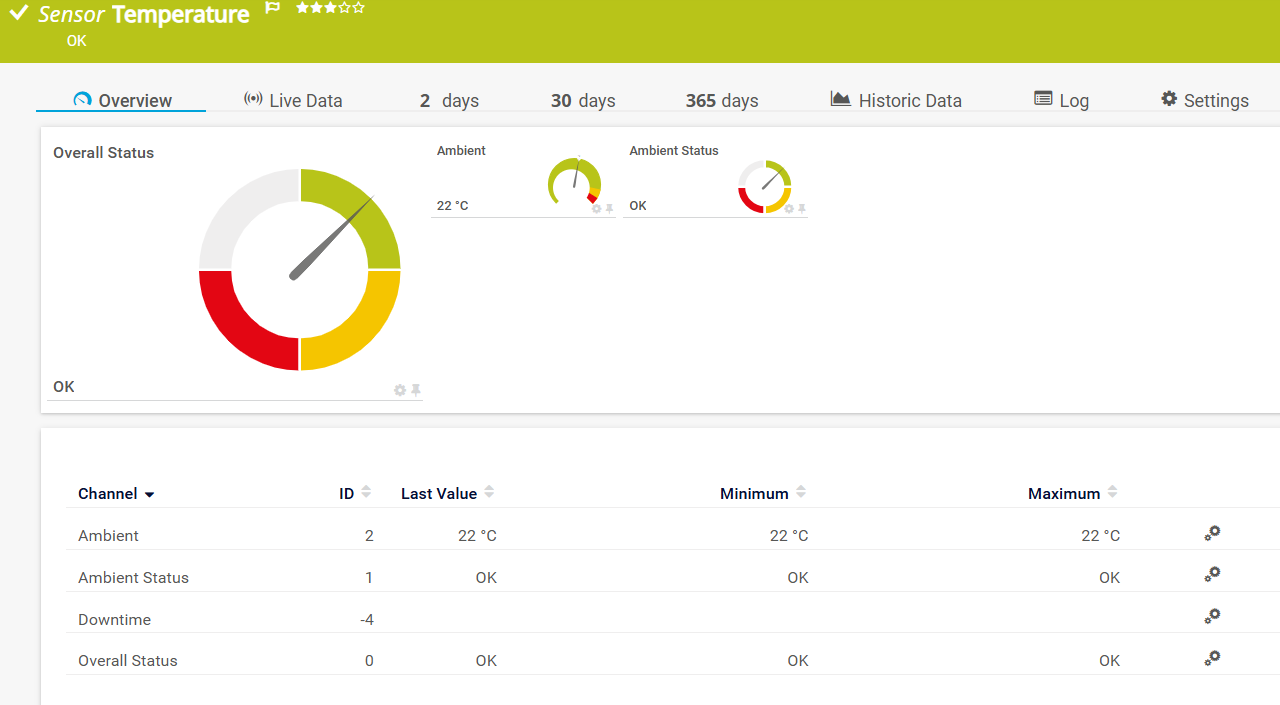
 For a detailed list and descriptions of the channels that this sensor can show, see section
 You cannot change the physical context group that this sensor monitors after sensor creation. If you want to monitor a different group, create the sensor again.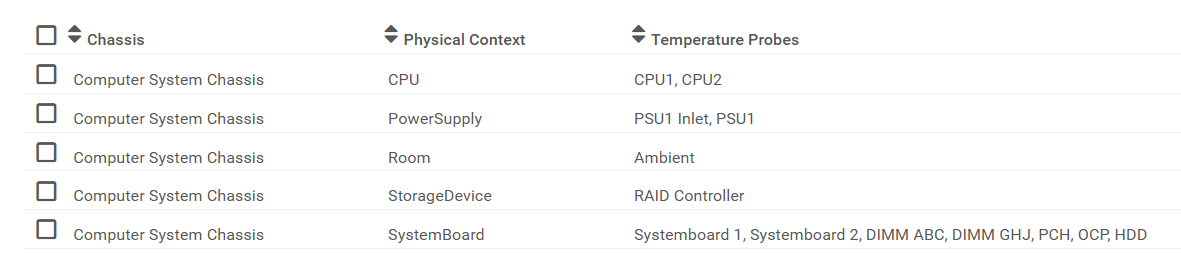



 This option is not available when the sensor runs on the hosted probe of a PRTG Hosted Monitor instance.
 under the corresponding setting name to disable the inheritance and to display its options.